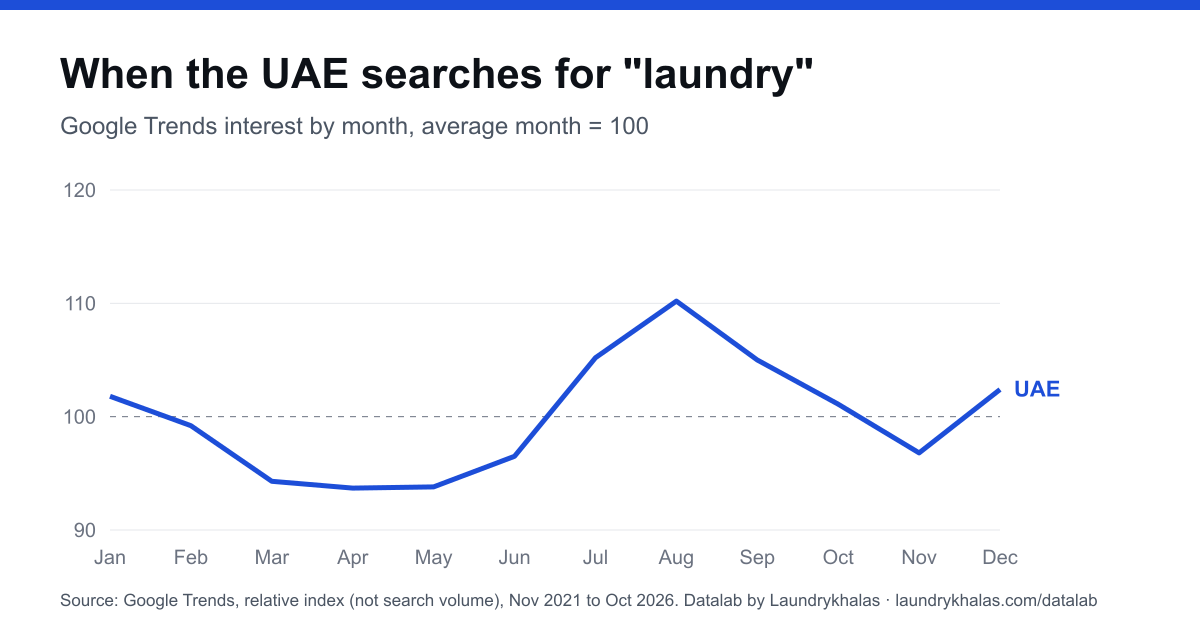
UAE searches for laundry peak in August
Google Trends interest in the United Arab Emirates, November 2021 to October 2026. 4 of 4 search terms carry enough weekly data to analyse.
Searches for "laundry" in the UAE run highest in August, 10.3% above the average month, and lowest in April. The seasonal pattern is strong (strength 0.56 on a 0 to 1 scale). مغسلة (maghsala) rises in the last two weeks of Ramadan in all five years, median +38%. Figures for journalists
Google Trends values are relative (0-100) to the peak of each query. They are not search volumes, and a value in one market cannot be compared with a value in another. 0 means too little data, not zero searches. مغسلة (maghsala) is Arabic for a laundry; the same word also means a washbasin or a car wash, so its series is not laundry-only.
Search interest, month by month
Monthly mean of the weekly index. Each term is on its own 0–100 scale, so compare the shape of the lines, not their height.
- laundry Oct 2026 81.3
- dry cleaning Oct 2026 59.3
- maghsala Oct 2026 53
- carpet cleaning Oct 2026 33.5
The shape of a year
Each month against that year's average month (= 100), averaged over five years. This removes the trend, so what remains is the repeating seasonal pattern.
- carpet cleaning Dec 112.7
- maghsala Dec 104.3
- dry cleaning Dec 103.5
- laundry Dec 102.4
Mean index by calendar month
Five-year mean of the Google Trends index for each calendar month, per term.
Every term, summarised
Weeks with data: share of weeks with a non-zero value; below 90% a term is not analysed. Range: peak minus low month as a share of the average month. Peak by year: the top month in each November-to-October year.
| Term | Weeks with data | Peak | Low | Range | Strength | Peak by year |
|---|---|---|---|---|---|---|
| laundry | 100% | Aug | Apr | 16.7% | 0.56 | Sep, Aug, Aug, Aug, Dec |
| dry cleaning | 96.5% | Aug | Jan | 18.3% | 0.19 | Nov, Jul, Jul, Nov, Jan |
| carpet cleaning | 92.7% | Apr | Sep | 34.8% | 0.14 | Nov, Jun, Apr, Apr, Dec |
| مغسلة (maghsala) | 100% | Jul | Oct | 22.5% | 0.48 | Jul, Apr, Aug, Jun, Apr |
The Ramadan test
Index during Ramadan, and in its last two weeks, against the eight weeks before Ramadan and the eight weeks after the Eid al-Fitr week. An effect counts as visible only if all five years move the same way and the median is at least 5%.
| Series | 2022 | 2023 | 2024 | 2025 | 2026 | Median |
|---|---|---|---|---|---|---|
| laundry: whole month | -4% | -4% | -3% | -5% | -7% | -4% |
| laundry: last two weeks | -5% | -5% | -4% | +2% | -9% | -5% |
| dry cleaning: whole month | -6% | -3% | +19% | -9% | -13% | -6% |
| dry cleaning: last two weeks | +8% | +16% | +16% | +19% | -19% | +16% |
| carpet cleaning: whole month | -9% | -4% | +21% | -39% | -18% | -9% |
| carpet cleaning: last two weeks | +12% | -10% | +27% | -23% | -19% | -10% |
| مغسلة (maghsala): whole month | -1% | +25% | +17% | +21% | +6% | +17% |
| مغسلة (maghsala): last two weeks | +16% | +43% | +19% | +38% | +39% | +38% |
Key findings
Each finding cites the exhibit it rests on and is labelled by how well it is evidenced.
- 1 "laundry": peak in August (+10.3% on the average month), low in April (-6.4%). Seasonal strength 0.56, strong; the peak month repeated in 3 of 5 years.
- 2 "dry cleaning": peak in August (+7.9% on the average month), low in January (-10.3%). Seasonal strength 0.19, weak; the peak month repeated in 0 of 5 years.
- 3 "carpet cleaning": peak in April (+23.1% on the average month), low in September (-11.7%). Seasonal strength 0.14, weak; the peak month repeated in 2 of 5 years.
- 4 مغسلة: peak in July (+12.3% on the average month), low in October (-10.2%). Seasonal strength 0.48, moderate; the peak month repeated in 1 of 5 years.
- 5 مغسلة (maghsala) rises in the last two weeks of Ramadan in all five years, 2022 to 2026, median +38%. The word also means a washbasin or a car wash, so the rise cannot be attributed to laundry alone.
Data provenance
What a reader needs to verify or re-derive anything on this page.
- Comparison query
- https://trends.google.com/trends/explore?date=today%205-y&geo=AE&q=laundry,dry%20cleaning,carpet%20cleaning,%D9%85%D8%BA%D8%B3%D9%84%D8%A9&hl=en
- Query: dry cleaning
- https://trends.google.com/trends/explore?date=today%205-y&geo=AE&q=dry%20cleaning&hl=en
- Query: carpet cleaning
- https://trends.google.com/trends/explore?date=today%205-y&geo=AE&q=carpet%20cleaning&hl=en
- Query: مغسلة
- https://trends.google.com/trends/explore?date=today%205-y&geo=AE&q=%D9%85%D8%BA%D8%B3%D9%84%D8%A9&hl=en
- Window analysed
- November 2021 to October 2026 (60 whole months); weekly data, "past 5 years" range
- Aggregation
- Weekly values averaged to calendar months (a week belongs to the month of its midpoint); partial final week dropped. Seasonal strength: share of the variance in year-normalised monthly values explained by calendar month.
- Generated by
- scripts/gen-datalab-demand.cjs
Use these figures
Free to republish with credit. The sentences below can be quoted as written.
- In the UAE, Google searches for "laundry" peak in August, 10.3% above the average month, and are lowest in April (November 2021 to October 2026).
- Search interest in مغسلة (maghsala) in the UAE rises in the last two weeks of Ramadan in each of five years, 2022 to 2026, by a median +38%.
- Share of search interest across the four terms in the UAE: laundry 77.9%, dry cleaning 5.3%, carpet cleaning 4.6%, مغسلة (maghsala) 12.2%.
- Google Trends figures are relative indices (0 to 100), not search counts.
- Chart: searches for "laundry" by month (PNG)
- UAE: monthly series (CSV)
- UAE: weekly series (CSV)
- Ramadan test, all markets (CSV)
- Read me: sources and licence (TXT)
Source: Datalab by Laundrykhalas, from Google Trends, with a link to this page. Free to republish under CC BY 4.0.
How to citeDatalab by Laundrykhalas (2026). Search demand for laundry in the UAE, 2021–2026. https://laundrykhalas.com/datalab/demand/uae/
EmbedSearch counts, orders or market size. Google Trends is a sampled, normalised index scaled to each query's own peak, so these figures cannot be compared with another market's page. Other spellings, other languages and searches outside Google are not included.
Method
Weekly values for the "past 5 years" range were read from the Google Trends explore view on 13 November 2026, each term on its own and the four terms together. Weeks were averaged into calendar months for November 2021 to October 2026, five years per calendar month. Full method and all markets: Search demand in the Gulf.